I don't know if this is what you're looking for exactly, but I've run forms of this activity a few times when introducing partial/directional derivatives.
Supply the class with materials: square grids printed on paper, scissors, compass (with attached pencil), ruler and protractor [Sometimes I forego the compass and just provide appropriately-sized circles printed on paper.]
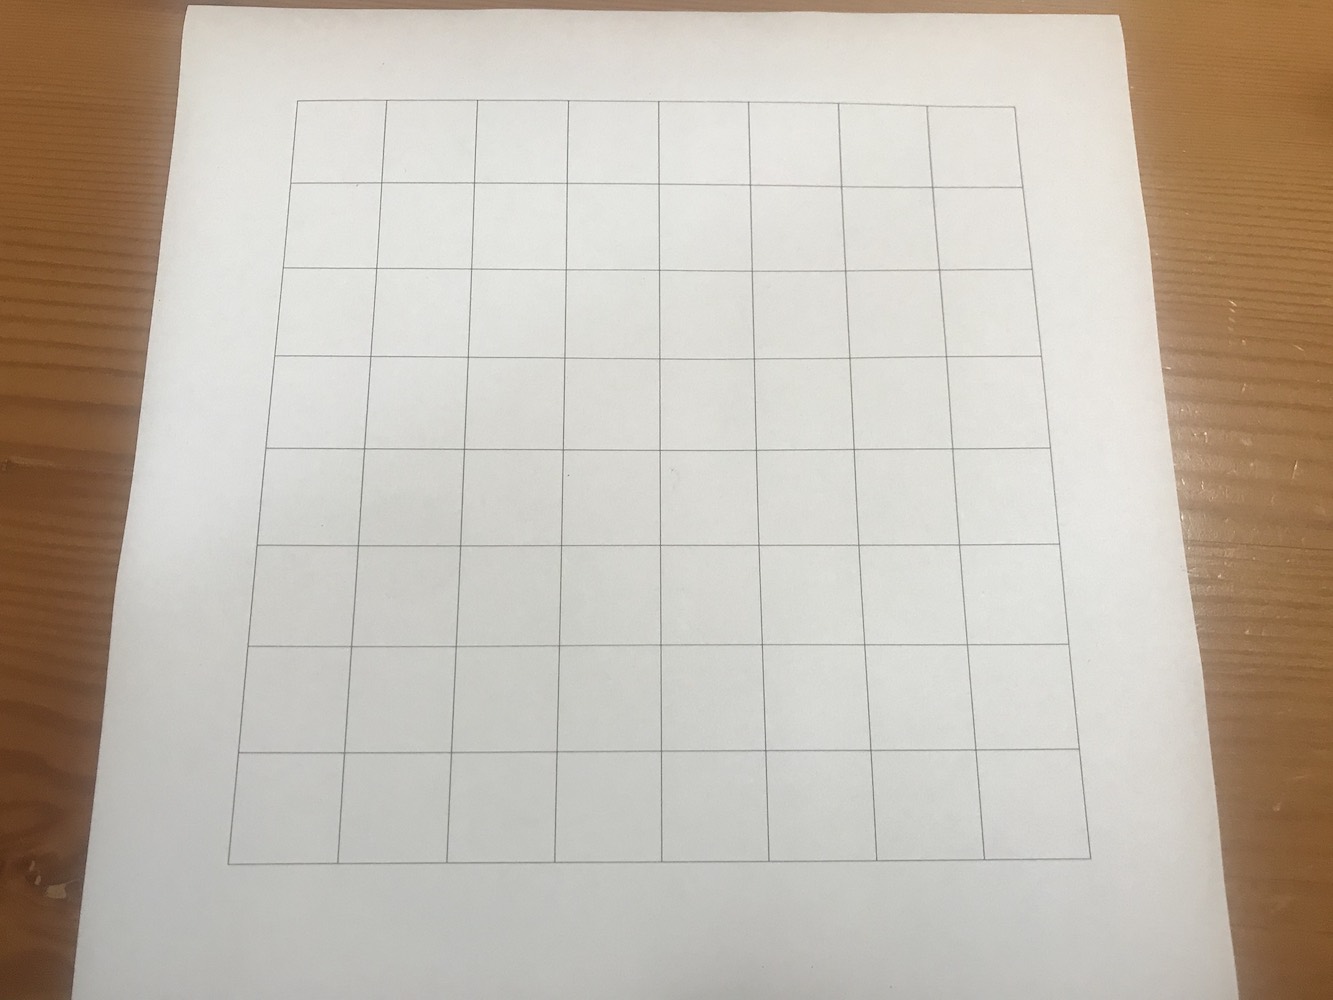
Give them the following directions:
Measure the length of three squares from the grid, and multiply this by $\sqrt{2}$. Call your result $r$.
Use your compass to draw a circle with radius $r$, and cut it out with scissors.
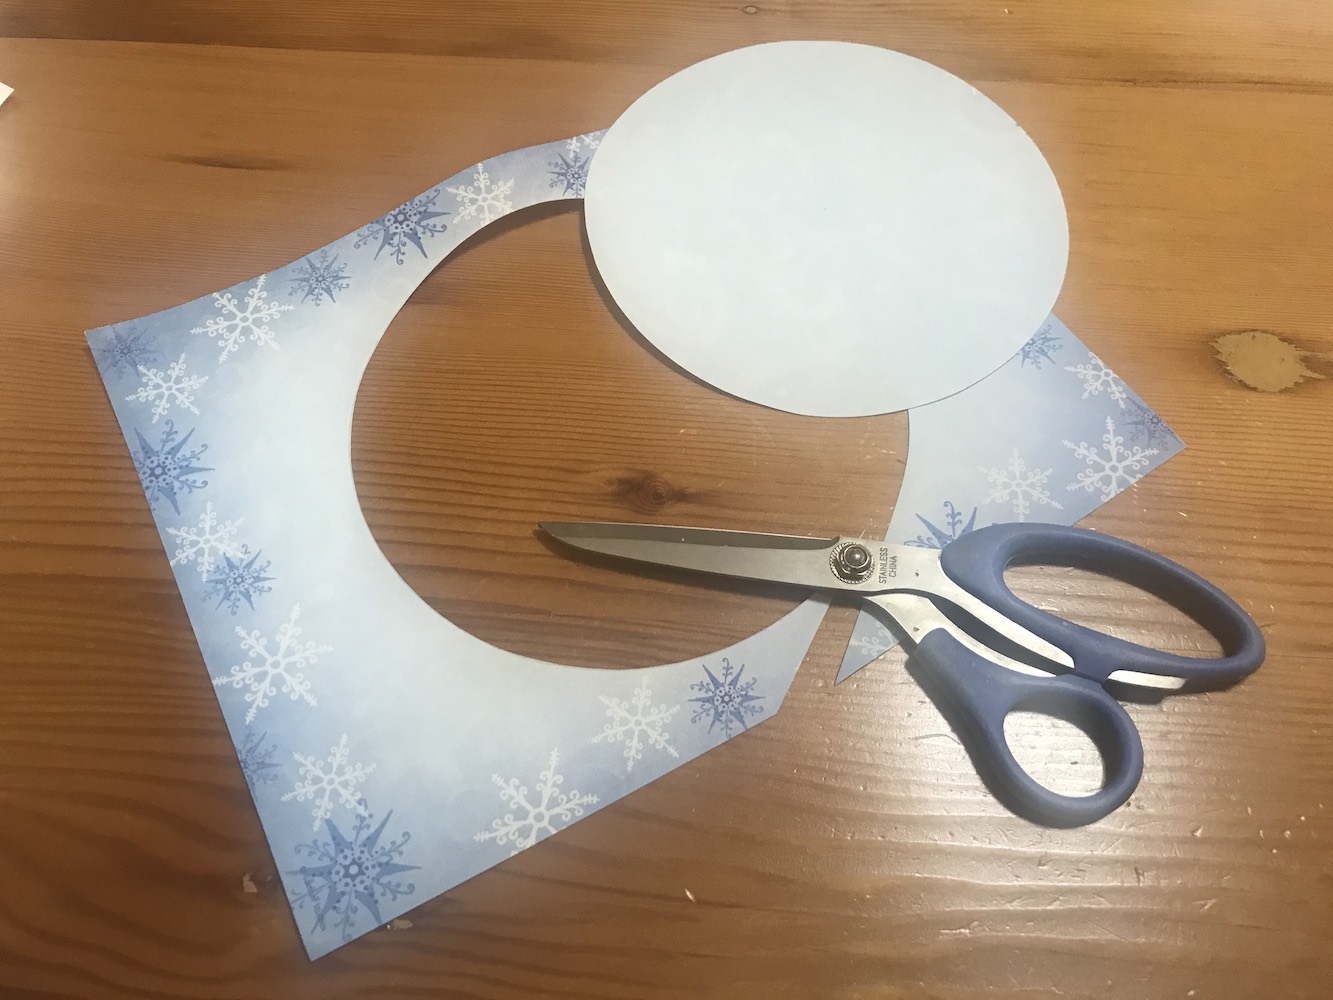
Mark a small point on the perimeter of the circle, labeling it #1.
With a protractor, find and label another point #2 on the perimeter which is $105.5^{\circ}$ away from point #1 (with the center of the circle as the vertex of that angle).
Cut a straight line from mark #1 to the center of the circle.
Curve the paper so mark #1 coincides with mark #2.
Tape your surface together (inside and out), being sure not to crease or otherwise deform the surface.
Draw an x-axis and a y-axis on the grid paper provided, so the origin $(0,0)$ is in the center of the grid.
Place your surface on the grid so the point is upward, directly above the point $(0,0)$ on the plane.
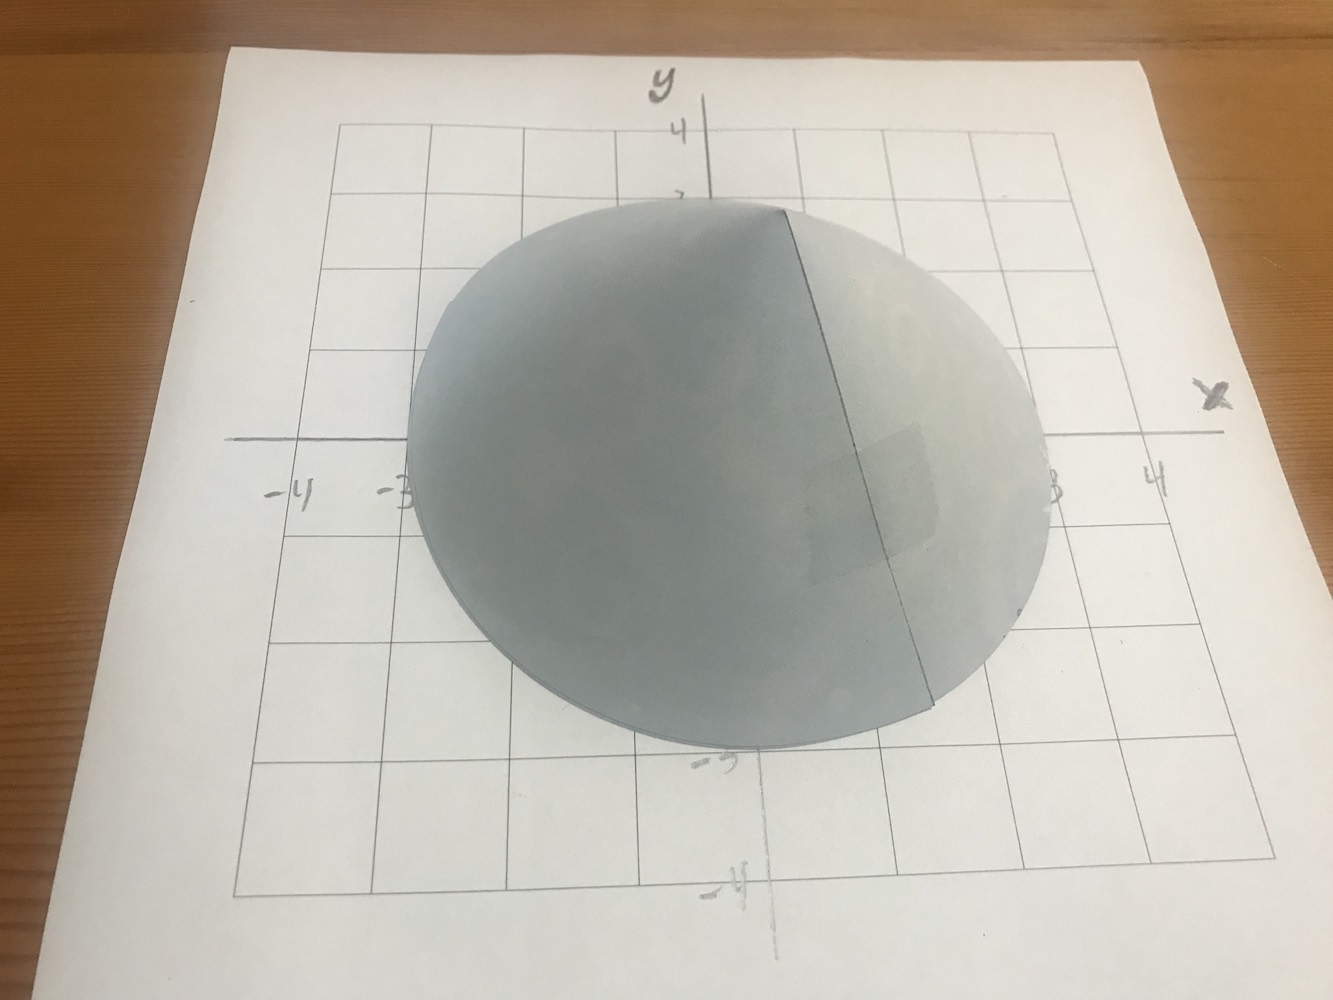
Congratulations! You have just made the surface $z=f(x,y)=3-\sqrt{x^2+y^2}$ which is part of (the bottom half of) a right, circular cone.
Then a series of questions, such as:
(a) What are the coordinates of the point of the cone?
(b) If you walked straight up the side of the cone, what would be the slope?
(c) What is $f(1,0)$?
(d) Plot the point $(1,0,f(1,0))$ on your surface.
(e) From that point, if you kept your x-value fixed but moved slightly in the y-direction, what would you experience as you moved along the surface of the cone? Approximate your slope at that point.
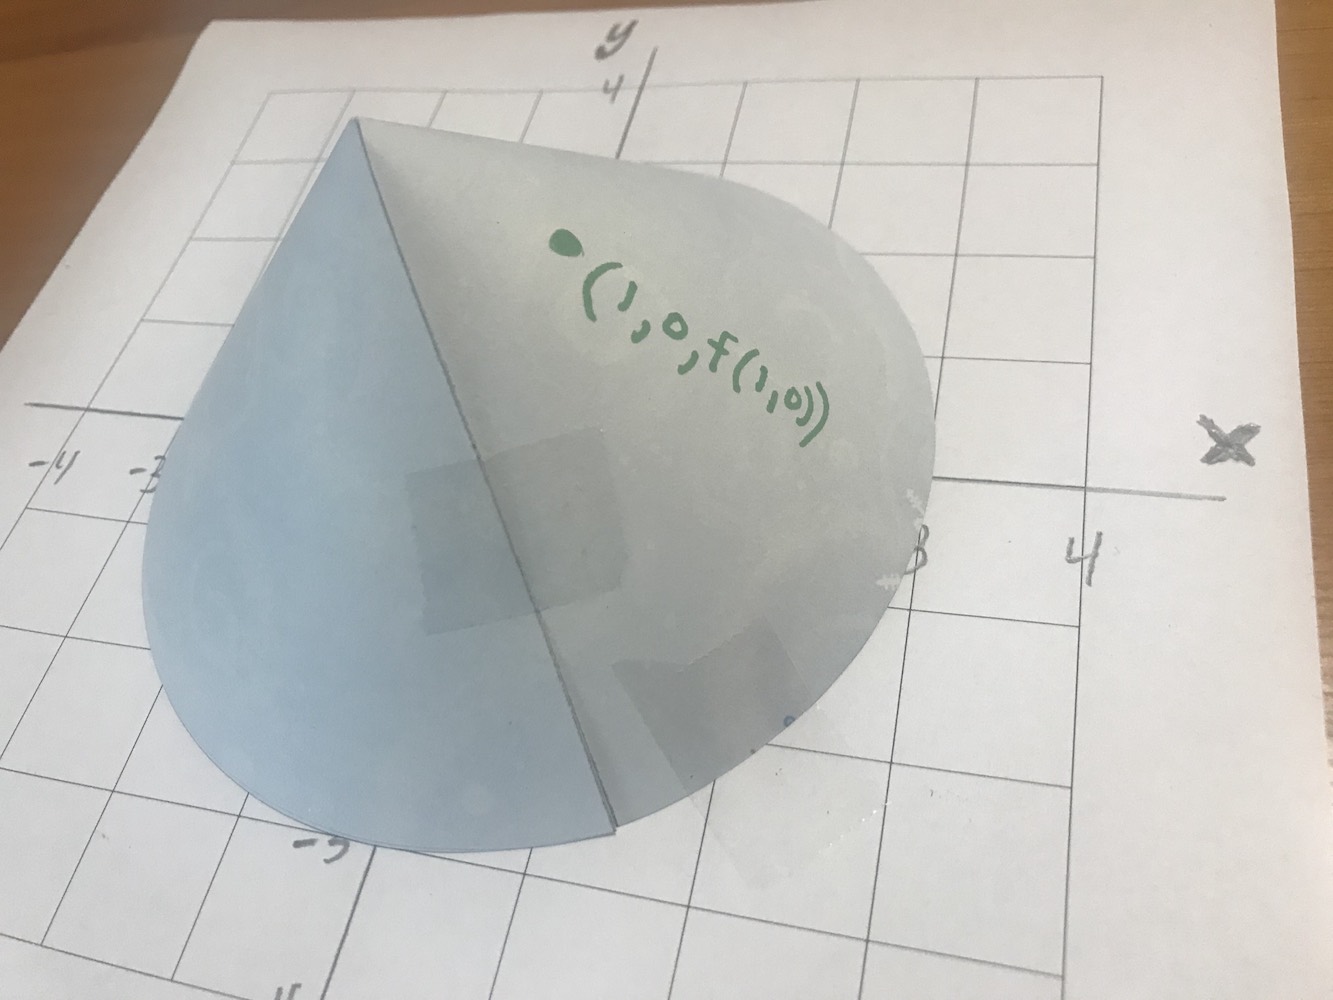
Repeat parts (c)-(e) with the point $(1,1)$ and $(1,2)$.
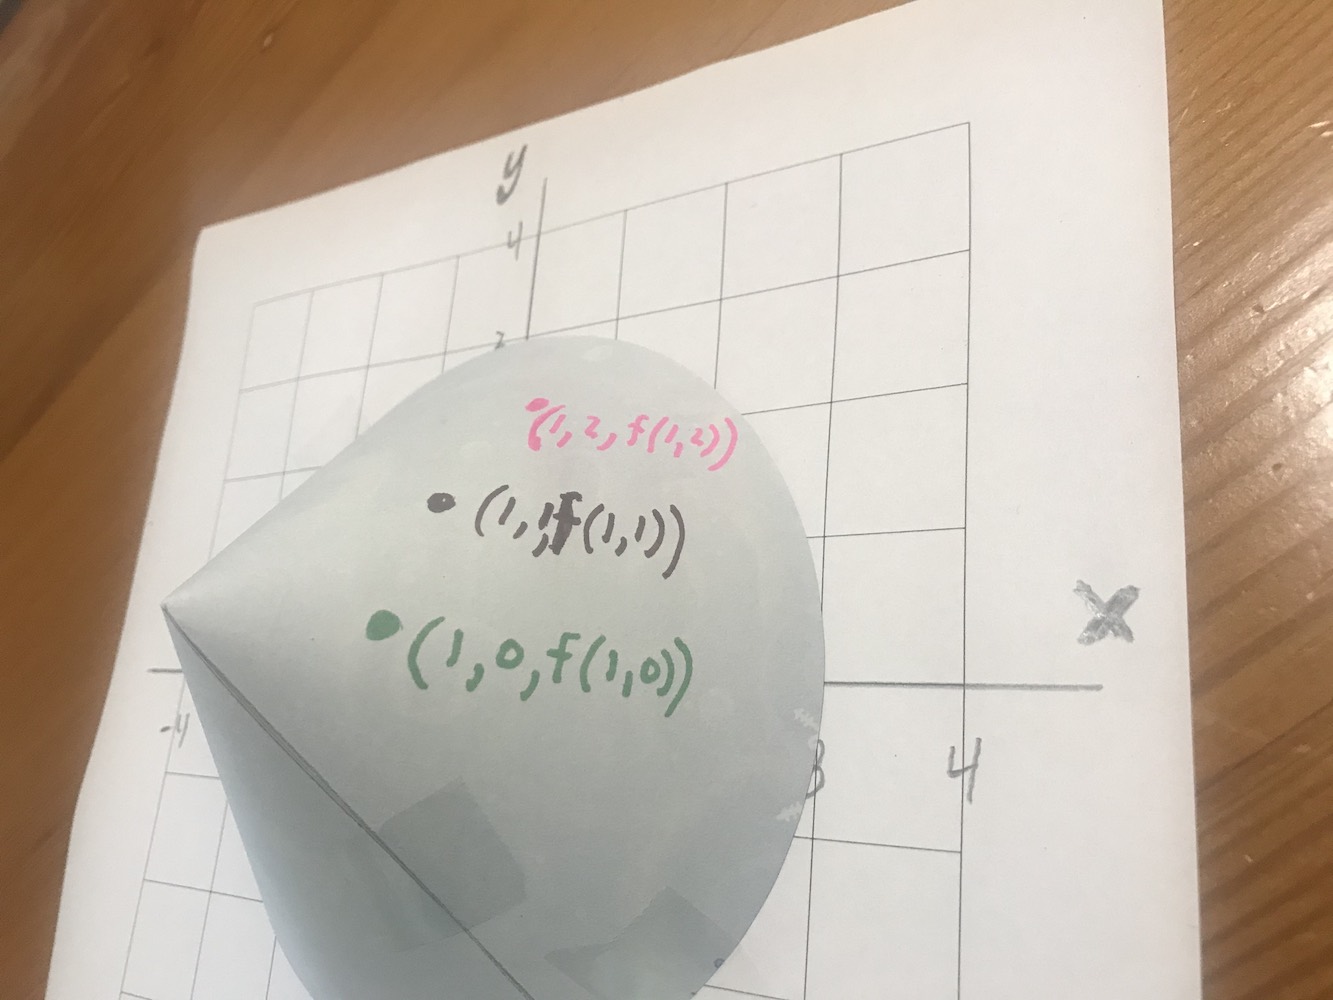
Compare your approximations of the slope at each of those points.
Now, Let's try this out algebraically. Since we're leaving the x value fixed, take the derivative of the function $z=f(x,y)=3-\sqrt{x^2+y^2}$ by imagining that $x$ is a constant. [That is, just differentiate with respect to $y$.]
Etc. [Connect the dots to make a slice. What is this curve? How can you see the "slopes" on this curve? Repeat questions where we move in x and not in y.]
It just happens to be the simplest surface I can imagine students building with any level of precision for measurement or approximation of slopes. It might be the first time in years that they have used a compass or a protractor, and it gets them handling a surface they built.
I'm sure there are other better examples of this kind of thing, but it has served me well for introductory purposes. There's probably a book of these types of activities, but this one just occurred to me to try once when I felt my students were too disconnected from the physicality of the topic.


