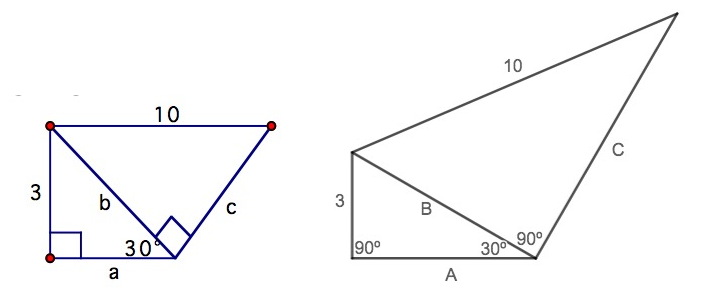
I've been working with a teacher, helping her with tech. One of the things I help with is to convert PDF formatted quizzes or tests to DeltaMath for the students to take online. The issue that I face is exemplified by the following image (the question text is simply, "solve for line segments A, B, and C." -
On the left is the question as presented to me. On the right is my effort on Desmos to graph the segments to scale. Now, the question I have - Should figures be to scale? Or is there some pedagogical value to "Make no assumptions beyond straight lines are in fact, lines. Use only the information given." Knowing the class as well as is possible, remote, I'd bet there would be far fewer correct answers on the left image. This question is part of a second year high school introduction to trigonometry, where the 'special right triangles', 30-60-90, and 45-45-90 are introduced.
If I were a student I would find the left image to either be a mean trick, meant to confuse, or a lazy teacher not willing to take the time to produce a scale image.
EDIT: I appreciate the answers here, especially for the fact that I learn by seeing an alternate approach to what my position is. For what it's worth, remote learning has taken our weekly class time from 240 minutes to 160. The answers here have me believe that "not to scale" is an important skill to navigate. I could spend a full 3 classes using published graphs in the media whose chosen X-Y scales obfuscate the conclusion one should reach. Real life examples to make that point. If my perfect scaling has a student get B=6 too easily, I'm ok with that. The 'A' value is what will tell me if they understood this lesson.

