2
$\begingroup$

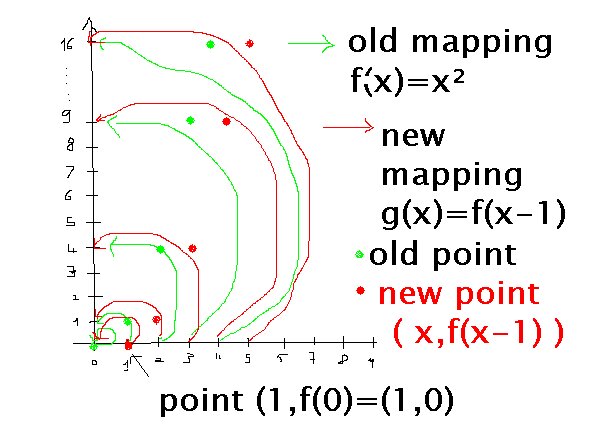
With the image below I try to explain in which way substituting (x-a) ( with a> 0) for x in the expression defining a function results in a shift to the right, although " intuition" tells us it should result in a shift to the left. To do this I use the auxiliary idea of "shifting" as "copying" or "imitating".

I would be interested in knowing whether this explanation could be efficient in the classroom at the high school level.

Suppose we have $y=f(x)=x^2$ and want to graph $y=g(x)=f(x-1).$

The function $g$ maps each $x$ to the image of $(x-1)$ under the function $f$.

In other words, each $x$ value has an "$ x-1$ " ( his own "$x-1$" ) , and copies his (x-1) 's image under the "old" mapping $f$ .

Since each "imitator" ( each $x$ value) is to the RIGHT of it's "model", that is it's " $x-1 $" , the change from the function $f(x)=x^2$ to the function $ g(x)=f(x-1)$ results , for each "old" point of the graph of f, in a translation of $1$ unit to the RIGHT.

enter image description here

Remark. - I first used the idea of " stealing" , for which I substitute the idea of " copying" or "imitating". I've just seen a post of Hyperpallium using the idea of " sampling" , even better.

Link to Hyperpallium's post : https://math.stackexchange.com/questions/2813164/seeing-why-horizontal-shifts-are-reversed
$\endgroup$
6
  • $\begingroup$ I'd highly recommend using Desmos to create the graphic you are looking to present us. I believe I understand your goal, but the shift is not clear enough when this is drawn by hand. y=x^2 that I know does quite look like this. $\endgroup$ Commented Mar 28, 2019 at 9:47
  • $\begingroup$ @Joe Taxpayer Thanks, I didn't know Desmos. $\endgroup$
    – user12116
    Commented Mar 28, 2019 at 10:13
  • 1
    $\begingroup$ Ray - happy to share that with you! One tip {3<x<7} for example, will restrict domain, so you can offer a small section of graph or piece wise functions. For more see the tutorial guide they have. $\endgroup$ Commented Mar 28, 2019 at 11:39
  • $\begingroup$ Please define what you take to mean "helpful" (title question); and the other question in your title ("if not beautiful?...) is really not on topic on this site. $\endgroup$
    – amWhy
    Commented Mar 28, 2019 at 17:31
  • 1
    $\begingroup$ I said to myself that humor could never be off topic... $\endgroup$
    – user12116
    Commented Mar 28, 2019 at 18:39

1 Answer 1

0
$\begingroup$

I tried two other ways along the graphical representation you are proposing.

  1. A lookup table:

In the first line note some values for $x$: -2, -1, 0, 1, 2

In the second line note the corresponding values of $f(x)=x^2$: 4, 1, 0, 1, 4

In the third line note the corresponding values of $g(x)=f(x-1)=(x-1)^2$: 9, 4, 1, 0, 1

Fill them out together with the pupils and let them observe that all the values of $g(x)$ are shifted by one to the right. Let them think about why this is the case and how they can get the values of the third line from those of the second line.

  1. A function with some particular "feature" like the extremum of a parabola or the first extremum or zero of a sine. Say, in the parabola case, to get the extremum you need to plug in $x=0$ into $f(x)=x^2$. So which value of $x$ needs to be plugged in into the shifted parabola $g(x)=(x-1)^2$? Obviously, a larger one to compensate for the 1 which is being subtracted before the squaring comes. Therefore, we will get the extremum at $x=1$, shifted to the right.

Both methods can (and probably should) be used together with the graphical representation as in the original question.

$\endgroup$

Your Answer

By clicking “Post Your Answer”, you agree to our terms of service and acknowledge you have read our privacy policy.