14
$\begingroup$

What is the most efficient way to create neat and consistent geometric drawings which I can insert into tests, worksheets, etc.?

Here are my primary concerns:

1) A simple drawing should be quick to draw, label, and insert into a document.

2) A drawing should be well formatted so that the lines are the right thickness, and the picture is cropped correctly.

3) A drawing format should be consistent so that all drawings I put into a document look like they were drawn the in same way (like in any decent textbook) and not like they come from 17 different places.

At present I use GeoGebra. I like it because it is free and very easy to use, but I doubt it is very efficient, and I especially dislike the way the pictures tend to blow up in size when I insert them into a document. Perhaps someone who uses GeoGebra can provide insight into how to best format GeoGebra so that the drawings fit well into Word documents.

$\endgroup$
10
  • $\begingroup$ I'm not sure what tag(s) to use for this question. Help is appreciated in that regard. $\endgroup$ Commented Apr 27, 2014 at 17:09
  • 6
    $\begingroup$ LaTeX + tikz = unbeatable;). $\endgroup$
    – mbork
    Commented Apr 27, 2014 at 19:19
  • 2
    $\begingroup$ Also, Metapost. $\endgroup$
    – mbork
    Commented Apr 27, 2014 at 19:29
  • 3
    $\begingroup$ I use Inkscape, which is open-source and multiplatform. $\endgroup$
    – user507
    Commented Apr 28, 2014 at 0:54
  • 1
    $\begingroup$ I second mbork's suggestion of LaTeX + TikZ, especially for consistent and well-formatted. For inserting in to a document, well it's easy if the document itself is LaTeX, and if not then using something like the standalone class makes it easy to make images from LaTeX documents for insertion in to other documents. If you give a flavour of what you want to draw, I could link to questions on TeX-SX of that type for you to see examples (without some guidance there's too many possibilities). $\endgroup$ Commented Apr 28, 2014 at 6:55

7 Answers 7

12
$\begingroup$

Over the years I have tried multiple tools including commercial and free, gui-based, script-based and LaTeX-based, vector, raster and 3D renderers. For the last three years I've mostly used Inkscape (official website, Wikipedia entry), which I strongly recommend.

Advantages: easy to use, enough effects, free, versatile.
Disadvantages: not as streamlined as commercial products, a bit rough font handling.
Stability: it crashed a few times (~10) during 3 years of use, each drawing was successfully recovered.

It is a great general vector program. Regarding geometry, it doesn't have features like GeoGebra (automatic constructions, linking points, etc.). On the other hand, the first picture below took about 5-10 minutes of work, which is not much. The middle one was easy, ~3 minutes, while the last was 30-40, because I couldn't get the curves right (these are not actual geodesics, i.e. were drawn by hand, not computer generated). For more complicated pictures, I sometimes use scripts to generate part of the drawing, and then finish by hand in Inkscape (the SVG being text-based helps a lot).
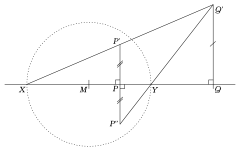
geometry automaton cone

Should you wish to see more examples, take a look at these math.SE posts: gradient triangles, angles, grid, hexagonal grid, areas, simple graphs, more complex graphs, more complicated geometry, function.

Regarding your points:

  1. To insert into LaTeX, export to PDF (use "File > Save a copy"), to insert into MS Word use EMF, for open office/libre office use SVG; if something does not work, you can always use a raster format like PNG (use "File > Export bitmap", use 300dpi for standard print, 1200dpi for quality print, 70-150dpi for computer screen).
  2. The biggest problem here is the picture size, and it is up to you to make it reasonable (whatever tool you use). Even with constant thickness of lines for each drawing, it might look bad if the pictures were created too big or too small. A way to get around this is to set the paper size before drawing. To crop the final result I use "File > Properties > Fit" with a small margin for each side.
  3. For the diagrams to be consistent, you have to be consistent. This is easy if don't change the settings too much. On the other hand, no tool will help you if you choose to use a different technique and colors each time.

I hope this helps $\ddot\smile$

$\endgroup$
7
$\begingroup$

I'm fond of asymptote, but it is not geared towards geometric diagrams. For me it is important that it integrates well with LaTeX (uses the same fonts, even complete math formulas). I use it more for general drawing. Take a look at the gallery, there are several geometric diagrams.

$\endgroup$
2
  • 1
    $\begingroup$ There is a geometry module for asymptote. See piprime.fr/files/asymptote/geometry for lots of samples. $\endgroup$ Commented Apr 30, 2014 at 15:01
  • $\begingroup$ The best thing about asymptote is that it is a full-fledged programming language, so you can easily create modules suiting your particular needs yourself and then just call them by including a single line with an import command. I use it a lot for all sorts of drawings and occasionally even for scientific computations when I want to see graphic representations that are tailored to my needs (Mathematica can produce good pictures too but you need to negotiate with it for half an hour to see exactly what you want to look at). $\endgroup$
    – fedja
    Commented Aug 4, 2022 at 3:44
5
$\begingroup$

I use Adobe Illustrator, but my school has a license so I don't have to purchase it myself. It is extremely versatile, but there is a learning curve. One can paste drawings and images created by other software into Illustrator, and then control many aspects in Illustrator before exporting into PDF or JPEG or whatever format is best for you.

Here is one example, rather plain, but I hope effective:


Fig.5.15 from DCG

$\endgroup$
2
  • 6
    $\begingroup$ If cost is an issue, one might consider Inkscape, which is another vector graphics program but is free/open source. (I've never used Illustrator, so I don't know how Inkscape compares as far as ease of use and functionality.) inkscape.org $\endgroup$
    – PersonX
    Commented Apr 27, 2014 at 22:04
  • 2
    $\begingroup$ @ChrisPhan I'd say that Inkscape is to illustrator about as much as Gimp is to Photoshop. Pretty close in features, but a bit less polished. $\endgroup$
    – Linear
    Commented Apr 30, 2014 at 18:53
5
$\begingroup$

Regarding this part of the question:

Perhaps someone who uses GeoGebra can provide insight into how to best format GeoGebra so that the drawings fit well into Word documents.

There are two distinct issues you might be having, and I am not sure which one is your main problem.

  1. When you export the Geogebra diagram to a picture (either via the clipboard or to a saved file) the output includes more of the canvas than you want, requiring you to crop the resulting image inside Word.
  2. When you paste the exported Geogebra diagram into the Word file it scales to fill the entire width of the page, requiring you to scale it back down to the size you want it to be.

Both of these problems are fairly easy to solve.

  1. When you export a Geogebra diagram to a picture file or to the clipboard, the exported image contains everything that is currently visible within the Geogebra window. When I work in Geogebra, I typically have my window filling the screen, but my actual construction is usually confined to a small portion of the window -- that way I have room to work in the margins as I construct and tweak things. So when it is time to export, I have to remind myself to manually shrink the window down so that only the portion of the diagram I want is visible.
  2. On the other hand if you are referring to the scale of the output, note that there is more than one way to export a Geogebra file to a graphic. The simplest way is to use "Graphics view to Clipboard" (under the Edit menu), but this gives you no control over the size or scale of the output. On the other hand if you use "File > Export... > Graphics view as picture" there is an explicit setting for the size and scale of the result. So if you want the exported image to be only 6 cm wide, you can set it to be so. Then when you paste the image into Word it ought to be just the size you want.
$\endgroup$
4
$\begingroup$

I personally use IPE to draw diagrams for insertion into TeX documents. Some benefits about it that I like:

  • It is free.
  • It generates .pdf outputs, easily inserted into TeX files or usable/viewable on their own.
  • It renders LaTeX text so you can label parts of diagrams easily.
  • The "grid snap" feature is great; quoting from the site linked above: "It is easy to align objects with respect to each other (for instance, to place a point on the intersection of two lines, or to draw a circle through three given points) using various snapping modes."

It also addresses your three points:

  1. I find it quite quick and easy to use, and it is especially easy to jump right in without the need to learn a bunch of stuff beforehand.
  2. You can choose thickness of lines, and the output will automatically crop around only the area you drew in.
  3. It's easy to make things consistent across different diagrams. You can copy/paste parts into new files, use the same features every time, etc.
$\endgroup$
4
$\begingroup$

Google Docs has a very convenient "Create drawing" option that has mist of the core functionality of Illustrator or Inkscape and requires no software download. I've used it for several papers and Wikipedia articles. As a total amateur, I find it easy to make lame drawings like this in 10 minutes:

Or this in 20 minutes: enter image description here

$\endgroup$
1
$\begingroup$

For exporting images made in Geogebra, this command is extremely helpful: https://wiki.geogebra.org/en/ExportImage_Command.

Towards the bottom:

pic1 = ExportImage("view", 2, "corner", A, "corner2", B)

Creates a GeoGebra image of View 2 and puts it in the view with position defined by A and B

Take a look at the other options within the command. You can choose to export a transparent image and even specify the file type !

$\endgroup$

Your Answer

By clicking “Post Your Answer”, you agree to our terms of service and acknowledge you have read our privacy policy.

Not the answer you're looking for? Browse other questions tagged or ask your own question.