Are there any resources which show Fourier series approximating a given waveform? I am looking for examples which have a real impact on students and provides motivation. I am trying to find something visual but it could be just audio based. Something to start the topic of Fourier series so that students are inspired to study this difficult topic.
8 Answers
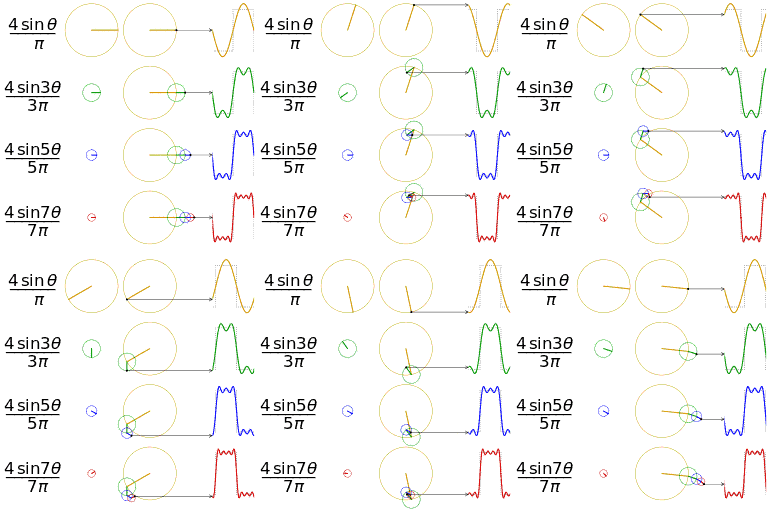
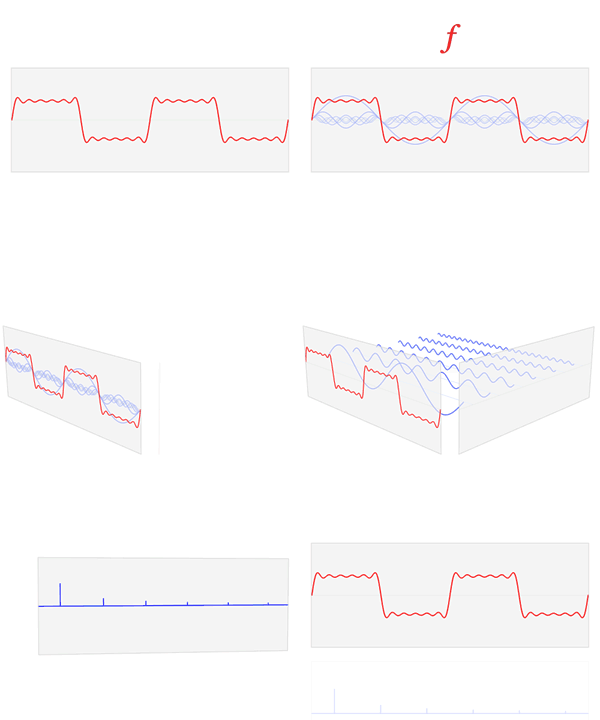
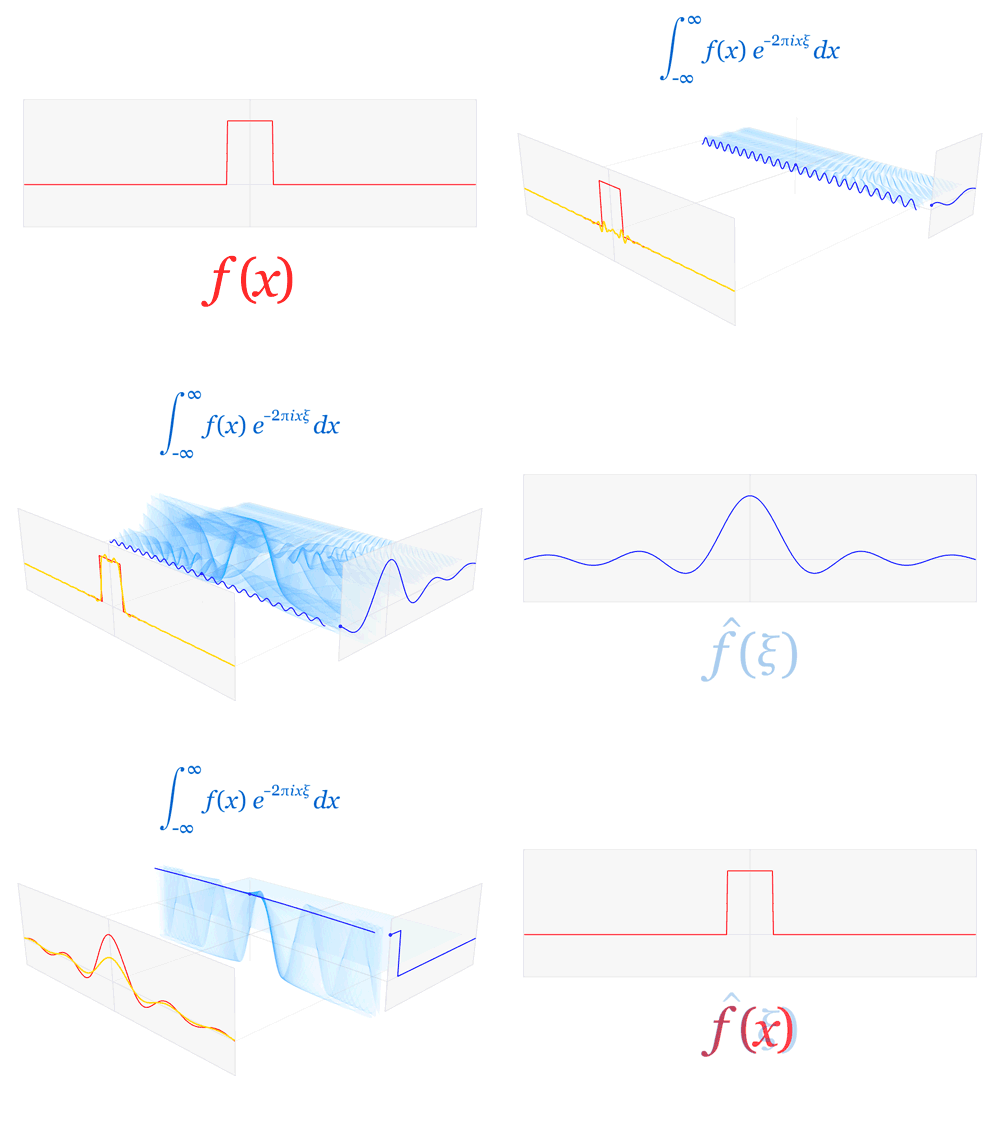
Wikipedia always has some great animations, often by User:LucasVB or User:Cmglee.
A few Fourier transform–related ones:
Approximating a square wave with a Fourier transform

(more of these for other functions here: sawtooth, triangle, partial cubic)
Fourier transform time and frequency domains

Continuous Fourier transform of rect and sinc functions

-
$\begingroup$ i know very little about fourier transforms but these are beautiful! $\endgroup$– celerikoCommented Mar 4, 2015 at 14:44
-
$\begingroup$ @celeriko Indeed. If you stare at them for a while, perhaps you'll know more than you think you do! $\endgroup$– AndrewCommented May 4, 2016 at 13:51
The Wolfram demonstrations project has several, including:
http://demonstrations.wolfram.com/FourierSeriesOfSimpleFunctions/
See here for the full list:
I would suggest using a freely available program to generate and analyse signals.
Audacity is a freely available program that can generate various waveforms (sine, square, triangle, sawtooth) and can also do Fourier analysis. It can also analyse real signals (record from microphone or import audio files). There is also a generator that can do freqency sweeps, and effects that include simple filters for when you get to that stage. It isn't limited to just simple filters, though.
This gives you a simple, interactive way to investigate simple signals and a path towards more interesting signals. You can look at the effects of changing sampling rate, Fourier length, and windows. You can also play the generated signals through the PC speakers so that you can hear what you are analysing.
Audacity isn't real time, but that is good when starting out - and when in a classroom. It can get quite loud when students are recording live signals, and the recorded signals won't be clean because of all the signals and the students talking. Using generated signals within the program is much simpler.
-
$\begingroup$ That's great! I never thought of using Audacity in that way. $\endgroup$ Commented Mar 2, 2015 at 14:03
-
$\begingroup$ Relevant video: Exploring Audacity's Spectrogram View (6:31). This shows how the spectrogram really adds a whole new layer of comprehension. For example, in the video, there are two different cats mewing, and this is immediately evident from the spectrogram, but not from just hearing the audio. $\endgroup$– wcharginCommented Mar 9, 2015 at 4:46
Jack Schaedler has created a wonderful "compact primer on digital signal processing" - SEEING CIRCLES, SINES, AND SIGNALS that includes a page with visualisations of the Fourier transform:
http://jackschaedler.github.io/circles-sines-signals/dft_introduction.html
-
2$\begingroup$ Your link leads to some very interesting articles, sites, and software. Thanks. $\endgroup$ Commented Mar 4, 2015 at 5:27
Depending on the audience I like to show a video of image reconstruction, as in https://www.youtube.com/watch?v=D9ziTuJ3OCw
I like to also show the alternative "Euclidean" reconstruction, where rather than global support you see that each component provides perfect information for only one pixel.
You might be interested in a purely mechanical approach. There are an interesting few videos by Bill Hammack on youtube showing a mechanical harmonic analyzer that combines and analyzes the first several terms of Fourier series:
3 blue 1 brown has an outstanding video on Fourier series:
https://www.youtube.com/watch?v=r6sGWTCMz2k
Thinking of a periodic complex valued map as a parametric curve in the complex plane, and thinking of the complex exponentials as "clocks" running at different speeds, the problem becomes: how do we draw anything using a bunch of revolving clocks stacked center to tip?
He develops the formula for the Fourier transform while keeping a tight correspondence between the symbolic and the graphical.
A bit late, but here's another one:
You have a choice of different input and window functions and you can interactively manipulate parameters like the frequency of your input or the width of the window. The output, i.e. the result of the (discrete) Fourier transform, is shown in real time. This is mainly intended for an audience of engineers, but I think it can help anyone who has to deal with this subject for the first time.
-
2$\begingroup$ Perhaps you could add some details/summary to your answer to make it more useful for users who are wondering whether to follow the link (or in case the link ever breaks). $\endgroup$– J WCommented Apr 29, 2016 at 14:11
-
$\begingroup$ Thanks for the suggestion, I've done that now. $\endgroup$ Commented Apr 30, 2016 at 10:57